Building our own analytics for fun and profit
How we built our analytics system for Mockoon's website and the desktop application, and why we did it.
Last year, we removed Google Analytics from this website, and even earlier, we removed it from the desktop app. We did this for one principal reason: nobody likes being tracked.
That being said, knowing if people are using your product is important. So, we decided to build our analytics system. Aside from this custom solution, we are proud to have a website and applications free of any other tracking or marketing tool, and third-party cookies.
Embark on this journey with us!
📈 By the way, Mockoon crossed 500k downloads in January 2024. Thank you all for your support! 🙏
What information do we want?
Many sources and signals exist to know if our product is successful: social posts, direct feedback, tools like Google Search Console, etc. But let's be honest, seeing the number of users increasing on a dashboard is good for the ego and can also keep you motivated. So, when building a product, we usually need to know two things: are people using it? And how are they using it? We will see that this is not always as simple as it seems, especially for the "how".
At the beginning of the project, we were using Google Analytics for both the website and the app. It's the most popular analytics tool, and it's free. Despite having decent knowledge of marketing and analytics, we quickly realized we weren't interested in 90% of the information it provided.
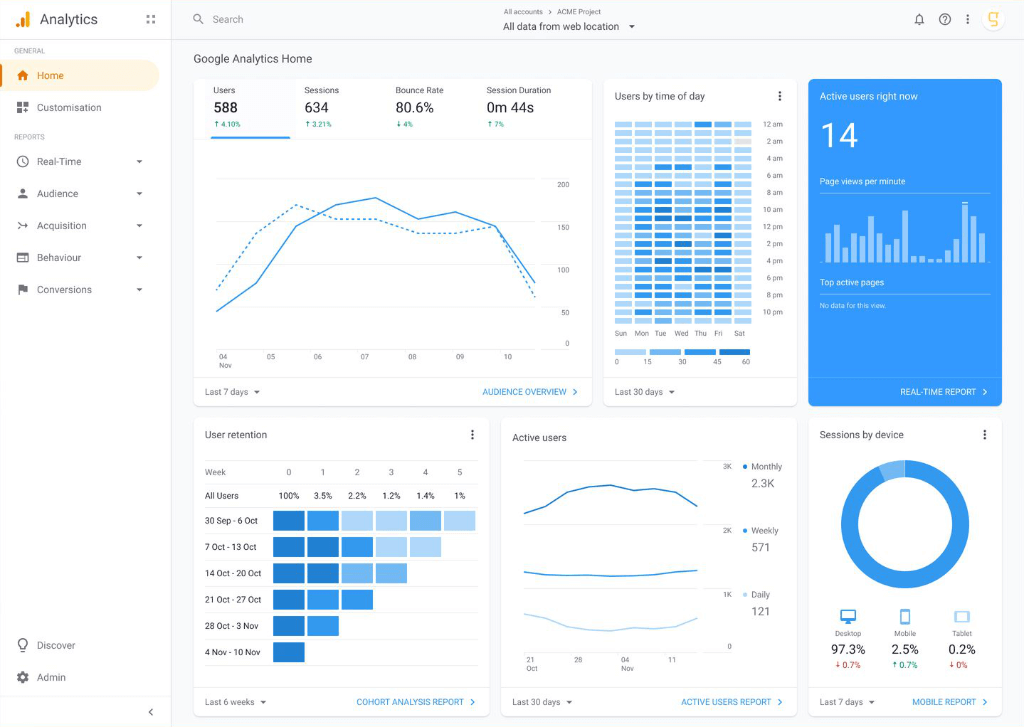 The sometimes overwhelming Google Analytics dashboard!
We were looking at the following metrics:
- For the website: number of visitors and page views (global and per page), referral source, entry pages, downloads, and countries. This, combined with Google search console data (keywords, impressions, clicks, etc.), gives us a good idea of how the website is doing.
- For the desktop app, we wanted to know how many people are using it, for how long (session duration), and which version and OS they are using.
💡 The CLI and serverless packages were always free of any telemetry or analytics system. The only information we have is the number of downloads per version on NPM and the number of Docker image pulls on Docker Hub (more than 2 million!).
That's it? And what about feature usage?
We were always focused on building a good product and providing stellar support, so we never tracked any feature usage through events as this would have been a lot of work to set up and analyze. But it was always tempting to understand if feature X was used, if it should be improved, or if it should be removed to simplify the code.
But while this can have some benefits, we think it can also be a double-edged sword.
Why? We usually decide how to prioritize features based on several factors that have sometimes nothing to do with usage:
- Upvotes and comments on GitHub's issues, but also the quality of the feedback: is the issue discussed? Are people chiming in to give their opinion?
- Occurrences of the issue through the support channels (support requests, etc.).
- Impact on the product: will it make it better? For whom?
- Impact on the user experience: is it mandating a new UI or is it a hidden feature, like a new templating helper?
- The complexity of the feature vs the benefit it will bring.
- The availability of a maintainer/contributor to work on it.
- Our own needs (we are also users of Mockoon) or sometimes interests (if it's fun, we may do it just for the fun of it).
This means that we can have wildly different paths for a new feature. Sometimes, less popular features find their way into the product because they are easy to implement. Or because we need them for our use or a contributor wanted to work on it. It's often the case with "harmless" features that are not directly visible in the UI, like automatically parsing something from the request or adding a new templating helper. If we would track the usage of such features, we bet we would be disappointed by the results. But we know they are useful to some people, and that's enough for us.
We can also measure the success of some features by analyzing the server logs. It is the case for the recent API playground we launched. We can see the number of requests in Cloud Run's logs. And it's probably enough.
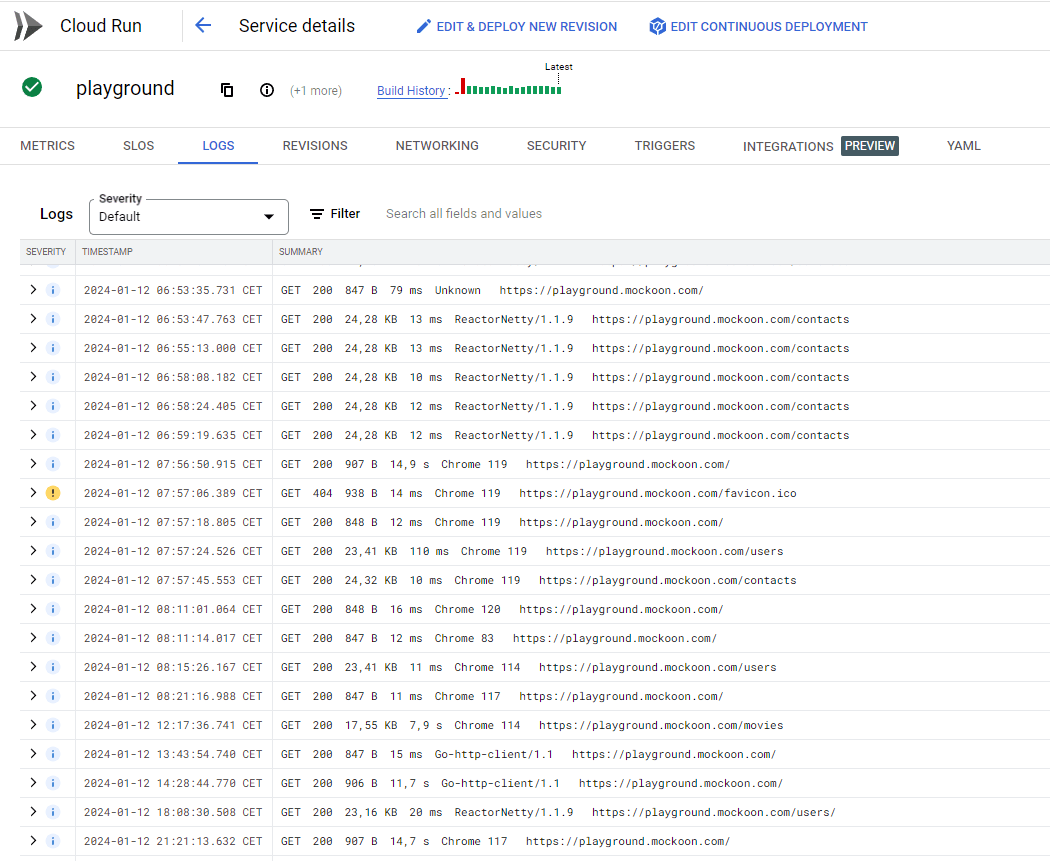 The API playground is a success!
Building our own analytics
Why not use an existing solution?
Being busy adding new features to the app, with support requests or writing content, the logical choice would have been to use an existing service, preferably privacy-friendly, like Fathom or Simple Analytics. But these solutions are not free and like all open-source projects, money is a scarce resource. So we decided to build our custom solution. And after all, we are developers, we like to build things. 🙂
Self-hosting an open-source or community version of one of the tools was also considered. However, the time required to understand the application, set up the infrastructure, and maintain it was probably bigger than rolling out our solution.
Our dead-simple solution
We decided to build a simple analytics system that could track basic events on the website and the desktop application.
Desktop application sessions
In the desktop application, we decided to track sessions containing the following information:
- An installation ID. Unique identifier for each installation of the desktop application. It allows us to know roughly how many unique "machines" are using the app.
- The session start and end time, approximately equaling when the application is opened and closed and giving us the session duration.
- A boolean to understand if it is a first session or not.
- The application version and OS to know the version distribution and which OS are the most used.
- The country code.
- The number of environments open in the app. This allows us to know how many environments are used on average and to optimize accordingly.
A preview of a typical session event:
Copy{
  "installationId": "2b241898-dfbd-4c5a-902a-0abfbb097587",
  "startTime": "2024-01-09T21:58:13.876Z",
  "endTime": "2024-01-10T14:09:09.962Z",
  "firstSession": false,
  "version": "6.0.1",
  "os": "darwin",
  "country": "BR",
  "environmentsCount": 19
}
Website page views and downloads
On the website, we copied a bit of how Google Analytics works and decided to track events with the following data:
- The type of event: a
pageviewor anevent. - The event name. Currently, we only track the
downloadevent. - The event category, to further qualify the event. Currently, we only track the operating system for the
downloadevent:win,macorlinux. - The page path to know which page was visited.
- The entry page path to understand which page was first visited and part of the user journey.
- The referrer URL to know where the user comes from. This is very useful to reach out to people who are talking about Mockoon on social media or blogs.
A preview of a typical pageview event:
Copy{
  "type": "pageview",
  "eventName": null
  "eventCategory": null,
  "date": "2024-01-10T15:08:28.844Z",
  "path": "/",
  "entryPage": "/",
  "referrer": "news.ycombinator.com/",
}
Technical implementation
Desktop application
The desktop application is built with Electron and Angular. The implementation is a bit more complex than the website (below) as many parameters are required to build the event object. The analytics code can be found in the telemetry.service.ts file.
The code can be a bit dry, and we are big fans of Observables, for the better or the worse (maybe the worse here!). You can see here the complete observable chain that builds the event object and triggers its sending to our API. To simplify, we build the session event object with all the required data (country code, session start time, etc.), and we send it with a session ending time after one of the following events occurs:
- The application is closed.
- The application is inactive for more than 1 hour.
- It's midnight 👻.
A small snippet of the code:
CopyswitchMap(() =>
  // end session and send infos after session duration inactivity or at midnight, or when app closes
  {
    const now = new Date();
    const midnight = endOfDay(now);

    return race(timer(Config.telemetry.sessionDuration), timer(differenceInMilliseconds(midnight, now)), this.closeSession$.pipe(filter((closeSession) => closeSession)));
  }
);
💡 We chose a 1 hour session time rather than the more traditional 30 minutes, as Mockoon tends to be used for long periods, often in the background.
Website
The website implementation is more straightforward. It is built with Next.js and the analytics code can be found in the analytics.ts file. It's a basic function that builds an event object and sends it to our API with a POST call. The event object is sent after each path change or when the user clicks a download button.
Copy// send a pageview event on each path change
useEffect(() => {
  sendEvent('pageview');
}, [pathName]);
API: Nest.js + App Engine
The API exposes two endpoints, one for the application telemetry and the other for the website analytics. The code is not public, but it's a very simple Nest.js application with a controller:
Copy@Controller('events')
export class EventsController {
  constructor(private readonly eventsService: EventsService) {}

  @Post('telemetry')
  @HttpCode(204)
  public telemetry(@Body() telemetryEvent: TelemetryDto) {
    return this.eventsService.writeTelemetry(telemetryEvent);
  }
}
We made sure to check the telemetry and events objects schemas with a Nest.js DTO:
Copyexport class TelemetryDto {
  @IsUUID() installationId: string;
  @IsString() startTime: string;
  @IsString() endTime: string;
  @IsBoolean() firstSession: boolean;
  @IsString() country: string;
  @IsString() version: string;
  @IsString() os: string;
  @IsNumber() environmentsCount: number;
}
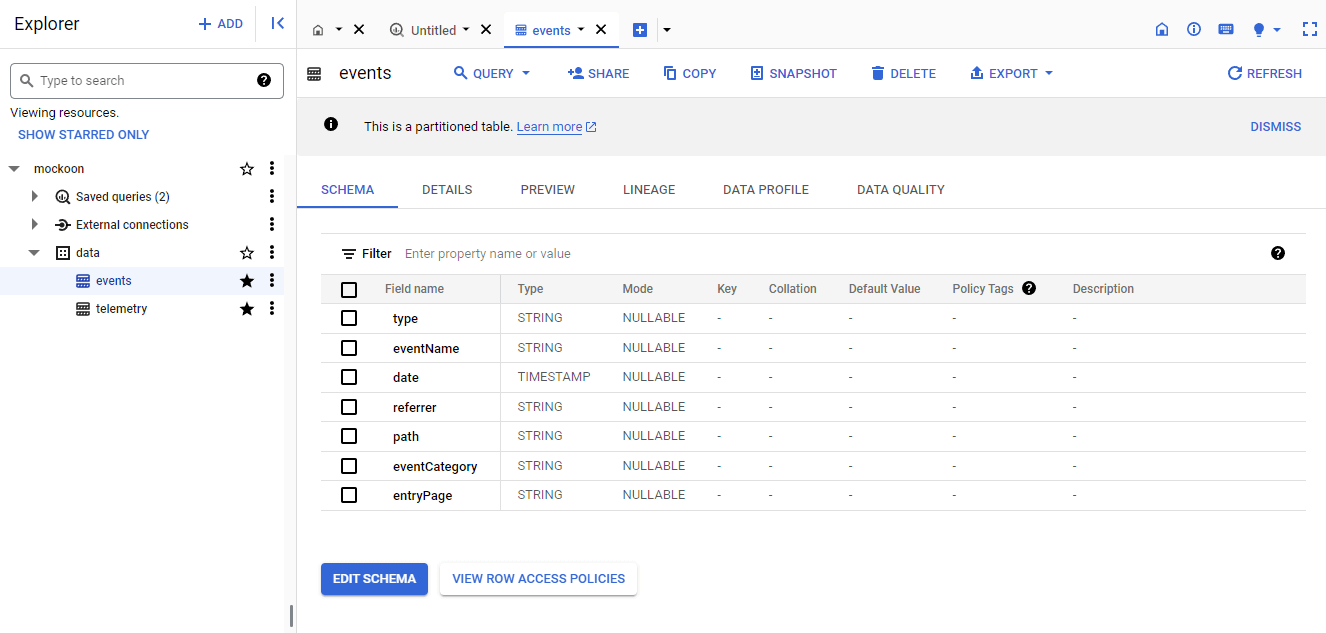
Events are then stored in two BigQuery tables. One for the application telemetry and the other for the website analytics. The schema of the tables is the same as the event objects.
Copy@Injectable()
export class EventsService {
  private readonly bigquery: BigQuery;

  constructor() {
    this.bigquery = new BigQuery();
  }

  public writeTelemetry(telemetryEvent: TelemetryDto) {
    const options = {
      query: `INSERT data.telemetry(installationId, startTime, endTime, firstSession, country, version, os, environmentsCount) VALUES(@installationId, @startTime, @endTime, @firstSession, @country, @version, @os, @environmentsCount)`,
      location: 'US',
      params: { ...telemetryEvent }
    };

    return from(this.bigquery.query(options));
  }
}
The same applies to the website events. The code has been shortened a bit for the sake of clarity.
The API is automatically deployed on Google AppEngine every time we push on the main branch using GitHub Actions. The whole setup is straightforward, and it's nearly a set-and-forget solution. AppEngine will auto-scale and provision new instances if needed.
Database: BigQuery
We choose BigQuery to store the data for its low cost at our volumes (see below). It's also easy to use from an API deployed on App Engine as it doesn't require any authentication. Everything is handled automatically. It also uses SQL, with which we are familiar.
We created two tables, one for the telemetry and one for the website events. The schema of the tables is the same as the event objects.
Infrastructure and costs
Google Cloud offers very generous free tiers. We benefit from one App Engine free instance per month and have a bit of extra cost when the traffic is higher and upscaling is triggered.
For BigQuery, despite our traffic and millions of events recorded, we have yet to pay a single cent. The first 10GB of storage and 1TB of data processed for queries per month are free. We are currently using less than a Gigabyte of storage and only a handful of Gigabytes of data processed per month!
Visualization: Looker Studio
The last brick of our custom analytics system is the visualization.
We use Google Looker Studio (previously Data Studio) to build a dashboard with the data from both BigQuery tables. We also aggregate the data from the Google search console. It's a really powerful tool (and free too!), but we must admit we struggled a bit with the concepts and wording. It was the most time-consuming part of this whole process.
We still managed to build a dashboard that shows us the data we need, and we are now very fluent in data analytics, but we still don't know the difference between a metric and a dimension...😁
You can see a preview of the dashboard below, showing the number of page views and downloads per day, the version distribution, the OS distribution, and the users' countries:
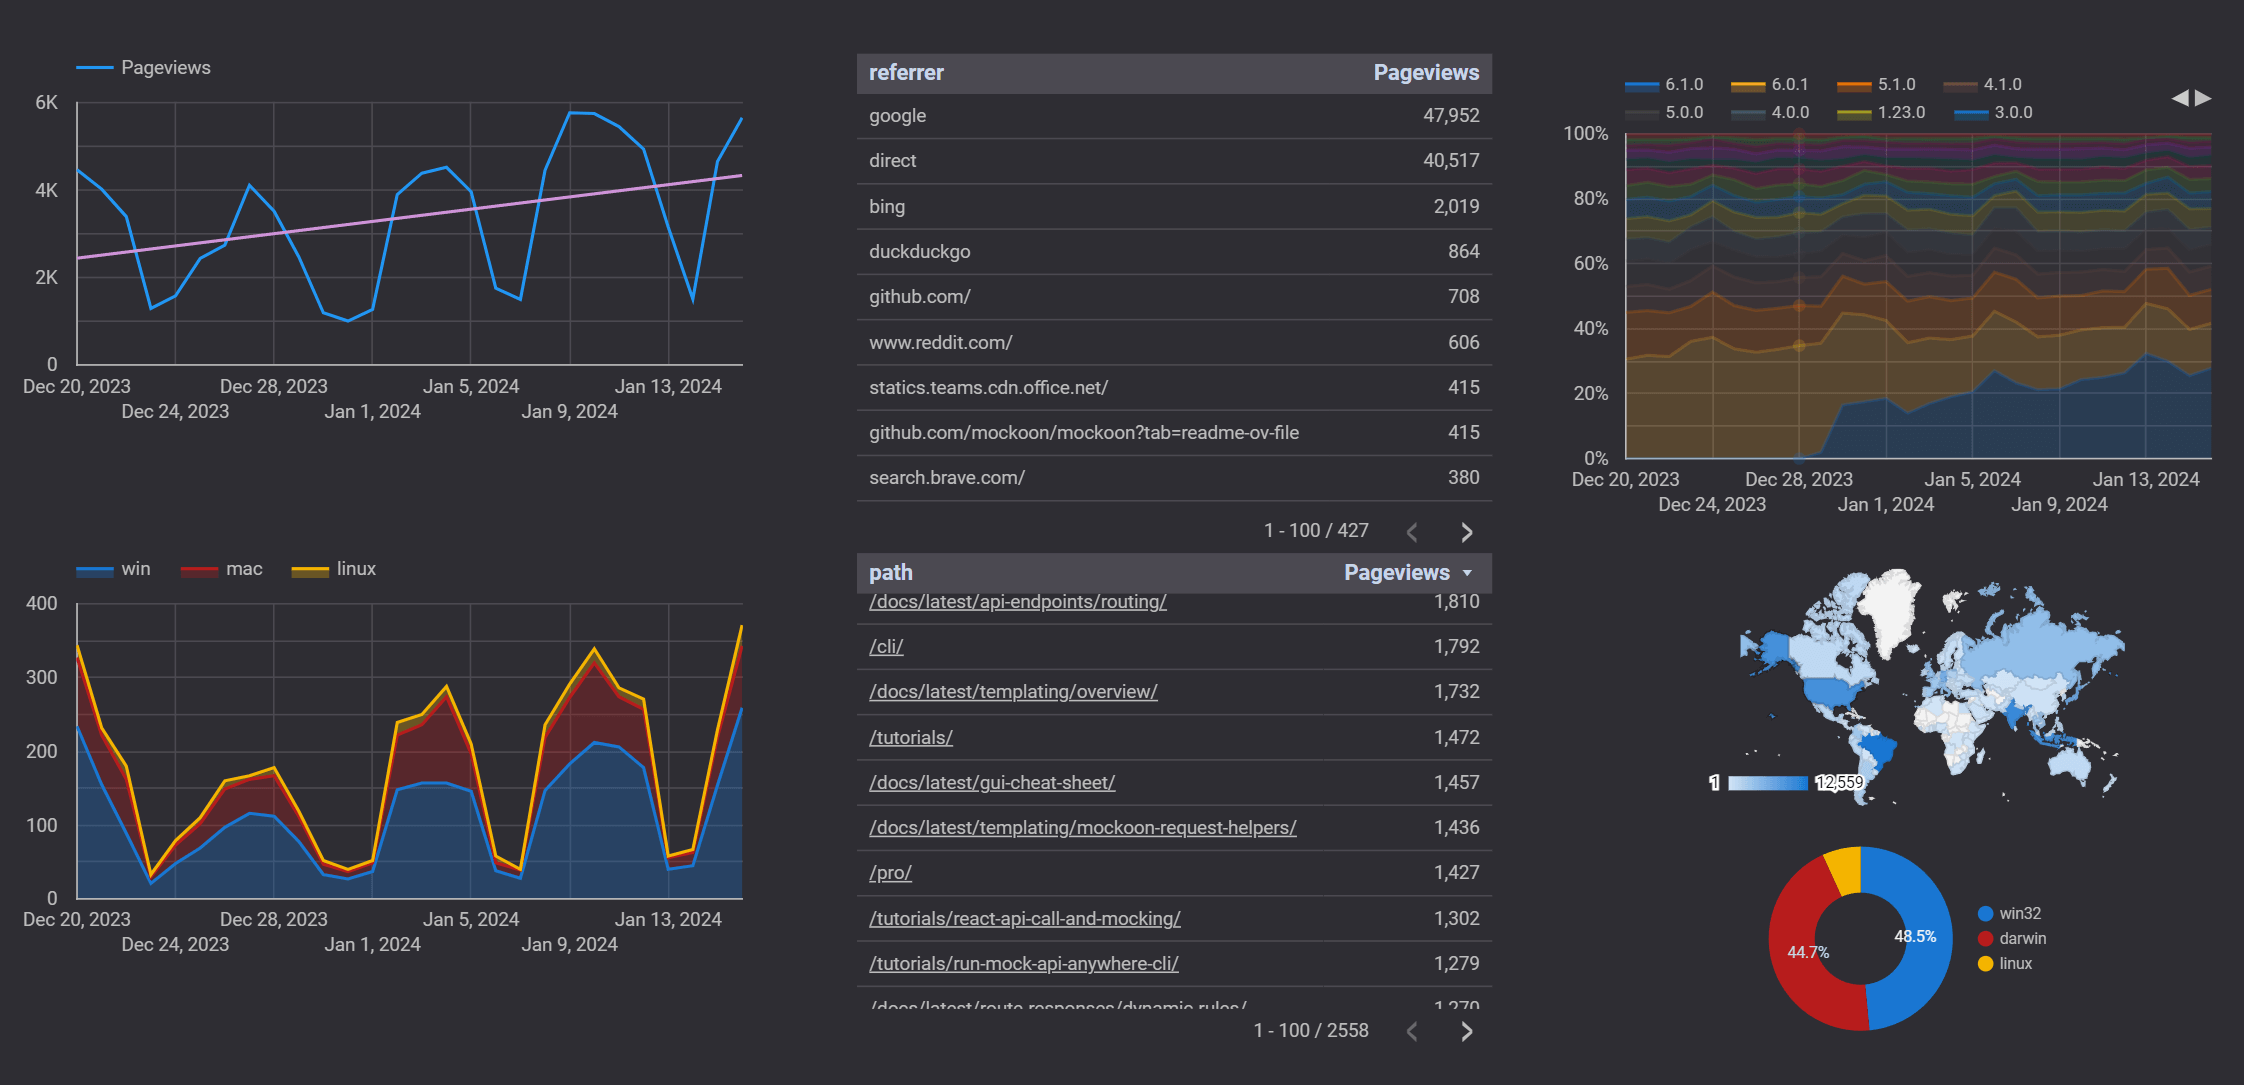 Second half of December is always a bit depressing! 😀
We hope you enjoyed this blog post and that it will help you build your analytics system or maybe convince you to use something that already exists!
You might also be interested in these articles
Roadmap update: faster releases and a self-hosting focus
We are moving to a monthly-to-bi-monthly release cycle for faster security response, and focusing the rest of 2026 on delivering a full self-hosted Mockoon offer.
Read moreSecurity Update: two vulnerabilities patched in v9.7.0
Two security vulnerabilities affecting Mockoon runtimes have been disclosed and patched in v9.7.0. We advise all users to update to version >= 9.7.0
Read moreMaintainer Month 2026: we're back!
We are proud to partner with GitHub once more for Maintainer Month, offering free Mockoon Cloud accounts to open-source project maintainers.
Read more